Lies, damned lies, and NZTA statistics
I’ve been doing a lot of reading lately about alcohol related harm. It is a serious issue for New Zealand and one that disproportionally impacts Maori. There is no doubt that alcohol causes great harm to New Zealand and as a society we should be working hard to reduce that level of harm. Although it is a few years old now, there’s a good summary here.
In the debate about The Trusts monopoly rights, alcohol related harm is a critical consideration. Would introducing competition and therefore private operators, including supermarkets, lead to greater levels of alcohol related harm? And if so, to what extent? Obviously, no one has a crystal ball and can answer those questions with absolute certainty. But we can look at the body of research available and the advice of the experts and formulate our own judgements about what is likely to happen.
In 2010, the Law Commission completed a comprehensive review examining and evaluating the then current laws and policies relating to the sale, supply and consumption of liquor in New Zealand. In their report ‘Alcohol In Our Lives: Curbing the Harm’ (NZLC R114, Wellington 2010), a chapter is dedicated to Licensing Trusts. The report mentions no evidence of a monopoly operator resulting in reductions of alcohol related harm. It provides this quote from a 1986 review:
The report also relates the Police’s submission, which stated that a monopoly created administrative simplicity (fewer licensees to deal with) but that decisions about the future of licensing trust monopolies should be made by local communities.
No doubt we’ll revisit the issue of alcohol related harms many times over the coming months in this blog. In this post I want to fact-check a claim The Trusts make in their marketing relating to alcohol related harm.
I had seen this claim a few times and never really thought too hard about it. But as we embarked on this adventure and I started to do a bit of research about licensing trusts, this claim just didn’t seem right. If the claim were correct, surely comprehensive reviews such as the 2010 Law Commission report would have uncovered such a positive impact. Here’s what I found.
It isn’t particularly easy to find how NZTA define their urban areas, but they were happy to provide a map when we asked.
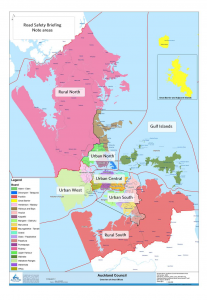
Clearly, the Urban West area is home to many fewer Aucklanders than the other urban areas and West Auckland also doesn’t have SH1 running through it. Populations from the 2013 census are in this table.
| Auckland City road safety sector | Population (2013) |
| Gulf Islands | 10,008 |
| Rural North | 55,440 |
| Rural South | 65,547 |
| Urban Central | 460,950 |
| Urban North | 285,240 |
| Urban South | 404,748 |
| Urban West | 156,522 |
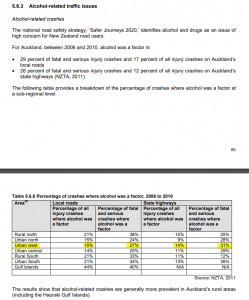
After a little digging, I noticed Auckland Council’s Local Alcohol Policy Research Report (available here) contains figures which contradict the claim made by The Trusts. In the Council document, the NZTA data (2006-2010) is presented as the % of crashes where alcohol was a factor, thereby taking into account differences in populations and types of roads between the regions. These figures show that West Auckland had the highest rates of alcohol related crashes among Auckland’s Urban Areas (with the exception of South Auckland’s local roads). Given that 10 out of 17 of the current elected members of The Trusts also sit on local boards or Auckland Council, it seems unlikely they have not come across this document.
Perhaps more recent data would be different. NZTA were happy to provide us with data for 2012-2017. This data didn’t provide a breakdown between local roads and state highways, but it did provide absolute numbers as well as a breakdown by year.
| Auckland City road safety sector | All crashes | Alcohol related crashes | Alcohol related crashes as a %age of all crashes | Annual alcohol related crashes per 100K popn | ||||
| Fatal & serious | All | Fatal & serious | All | Fatal & serious | All | Fatal & serious | All | |
| Urban Central | 976 | 27092 | 134 | 1673 | 14% | 6% | 4.8 | 60.5 |
| Urban North | 398 | 11541 | 59 | 735 | 15% | 6% | 3.4 | 42.9 |
| Urban South | 777 | 19779 | 136 | 1694 | 18% | 9% | 5.6 | 69.8 |
| Urban West | 279 | 5878 | 62 | 652 | 22% | 11% | 6.6 | 69.4 |
This data shows that Urban West did indeed have the lowest absolute number of alcohol related crashes among Auckland’s urban areas. But as a percentage of total crashes, West Auckland had the highest incidence of alcohol related crashes in every year between 2012 and 2017. The rate of crashes per population paints a similar picture. For those interested, here is the full data set.
So what has happened here? The Trusts statement may be based on a different data set. Given they have cited NZTA as the source however, it is probably the same base data underpinning the claim. They may have analysed the data in a different way, and that analysis might show West Auckland to have the lowest incidence. I think that’s unlikely because our simple analysis gives a clear indication that West Auckland isn’t the lowest. It isn’t even close. The most probable explanation is that the statement is based on absolute numbers of alcohol related crashes. Comparison of absolute numbers is not a reasonable basis for comparison between geographic areas of different sizes / population and with different types of roads.
In my view, The Trusts assertion that “It’s working! According to NZTA, West Auckland has the lowest incidence of alcohol related crashes in Auckland Council urban zone areas” is misleading. The Trusts appear to have framed the data in such a way that it misrepresents the true incidence of alcohol related crashes in West Auckland. Intentionally or not, they have deceived the community by creating a perceived benefit where there is no credible evidence of such.
As a result of these findings, I have laid a complaint with the Advertising Standards Authority on the basis they have breached the Advertising Code of Ethics:
- Basic Principle #3 “No advertisement should be misleading or deceptive or likely to mislead or deceive the consumer”
- Rule #2: “Truthful Presentation – Advertisements should not contain any statement or visual presentation or create an overall impression which directly or by implication, omission, ambiguity or exaggerated claim is misleading or deceptive, is likely to deceive or mislead the consumer, makes false and misleading representation, abuses the trust of the consumer or exploits his/her lack of experience or knowledge. (Obvious hyperbole, identifiable as such, is not considered to be misleading).”
Is this simply an oversight? Perhaps. But this claim is prominent in their recent marketing. It appears on their website, in the mailer ‘Our West’, in pamphlets and also on screens in-store. It would be dumbfounding if they had not at least looked at a map to confirm that Urban West was a reasonable proxy for the Licensing Trust districts. Any rational person viewing that map would immediately understand that NZTA’s regions within Auckland are not of equal size and therefore the number of crashes cannot be directly compared.
No doubt, The Trusts will have an explanation and the Advertising Standards Authority will give them an opportunity to explain. For the time being, we will withhold judgment and wait to see what the Advertising Standards Authority finds.